How to Use the Analyze Page
The Analyze page is a multi-tab dashboard that consolidates your marketing performance data into one workspace. Depending on your plan and connected channels, you have access to up to three tabs: Analysis & Commerce, Social, and CRM & Email.
| Tab | What it shows | Required |
|---|---|---|
| Analysis | AI-generated performance summary of your overall performance with 4 insight cards covering an overall summary, wins, outliers and risks, and action items | Pro or Agency plan |
| Commerce | Collects order data from your store and shows segments by spend, frequency, and, importantly, purchase after being contacted by a Journey or Campaign message. | Connected Store |
| Social Media | Aggregate metrics, historical trends, top posts, platform breakdowns | Always shown |
| Email / CRM & Email | Email Campaign and Journey metrics, open/click rates, SMS delivery stats, commerce cohorts | Email and/or CRM enabled |
The default tab is Analysis if you have Pro or Agency access, or Social if you are on the Basic plan.
AI Summary, Analysis & Recommendations
The Analysis tab provides an AI-generated performance summary. It combines the last 30 days of social media, email, and SMS metrics into four structured insight cards. The summary is Brand-specific, and freshly generated (daily) when you load the page or generate a report.
The Four Insight Cards
The AI summary is displayed as a 2-column grid of four cards:
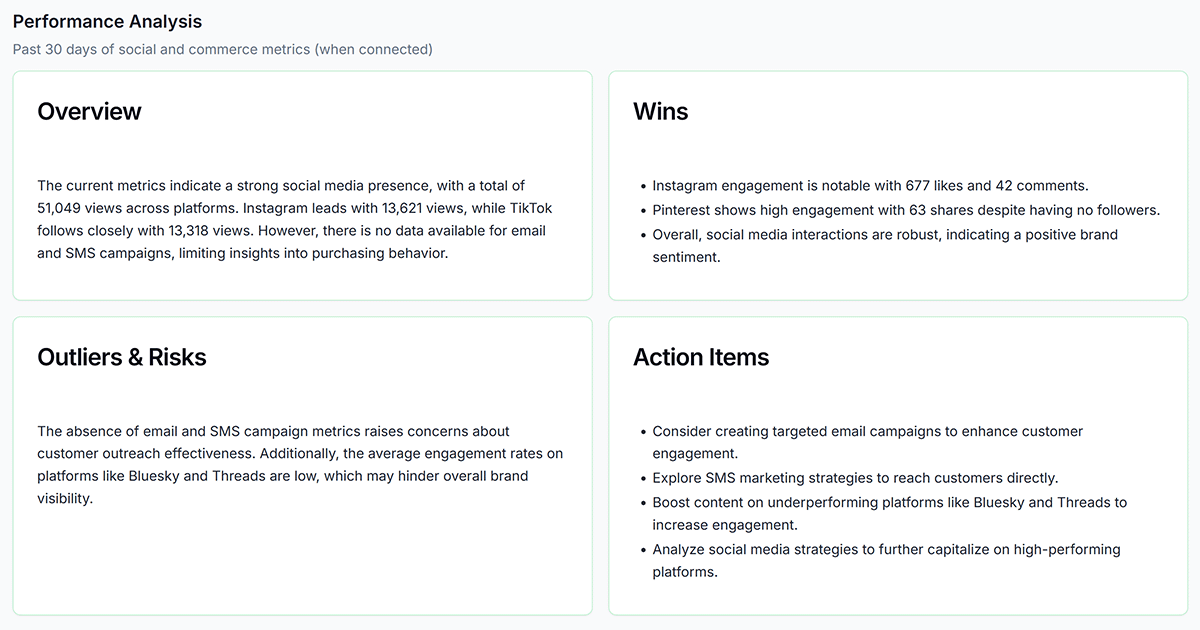
- Overview — A high-level summary of performance for the month: top channels, send volumes, key stats across social, email, and SMS.
- Wins — What performed above average: high-open campaigns, top-performing posts, successful journey completions.
- Outliers & Risks — Anomalies and concerns: underperforming content, elevated bounce rates, growing complaint rates, concerning trends.
- Action Items — Specific, prioritized next steps the recommendations to improve your performance across channels.
Commerce
If your Shopify or WooCommerce store is connected and has order data, the Analysis tab also displays Commerce Cohort metrics below the analysis cards. These metrics show spend frequency breakdown and revenue attribution across your contact segments. This data does not appear if your store is not connected.
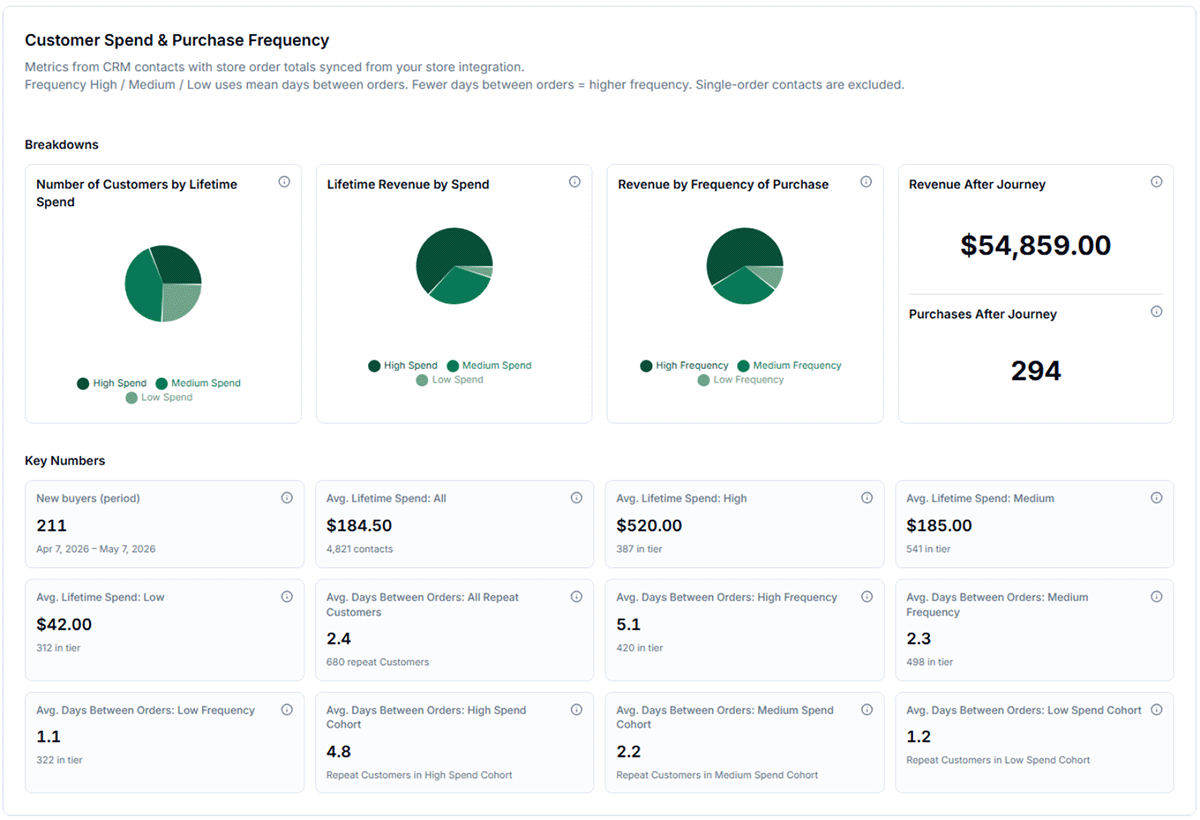
- Purchase After Journey — tracks the number and total revenue of purchases made after being contacted by an Email or Journey message. This is a powerful way to measure the effectiveness of your automated sequences.
- Spend: High / Medium / Low — distribution of contacts by total spending
- Purchase frequency: High / Medium / Low — how often contacts have placed orders
- Purchases: First order only — one-time buyers who may respond to a loyalty or re-engagement campaign
- The Analysis section always uses the last 30 days — this window is not adjustable.
- Generating a new summary may take up to a minute on first load; subsequent views use the cached result.
- SMS metrics are included in the Analysis tab when SMS is enabled on your account.
- If the Analysis tab is not visible, your plan does not include Pro or Agency features — upgrade in Billing to get these valuable and actionable insights and have white-labeled reports delivered to your inbox every week.
CRM & Email
CRM analytics appear on the Email / CRM & Email tab and cover journey performance, commerce cohort data (Shopify), and contact segment health. Use this data to understand how your automated sequences and contact list are performing.
Journey Performance
The journey performance table shows metrics for every active (and historically run) journey for your brand. Key columns include:
- Enrollments — total contacts who entered the journey
- Completions — contacts who reached the end of the journey sequence
- Average open rate — average open rate across all email steps in the journey
- SMS sent / SMS delivered — total SMS messages sent and confirmed delivered from journey SMS steps (if SMS enabled)
- Purchases — revenue-attributed purchases from journey emails (if Shopify is connected)
A healthy journey completion rate is above 70%. If completion is low, check whether contacts are exiting early due to a condition branch or a bounce. Rows are sorted by Purchases (descending), then by Email Sent.
Segments
Segment data shows the performance of both system and custom segments.
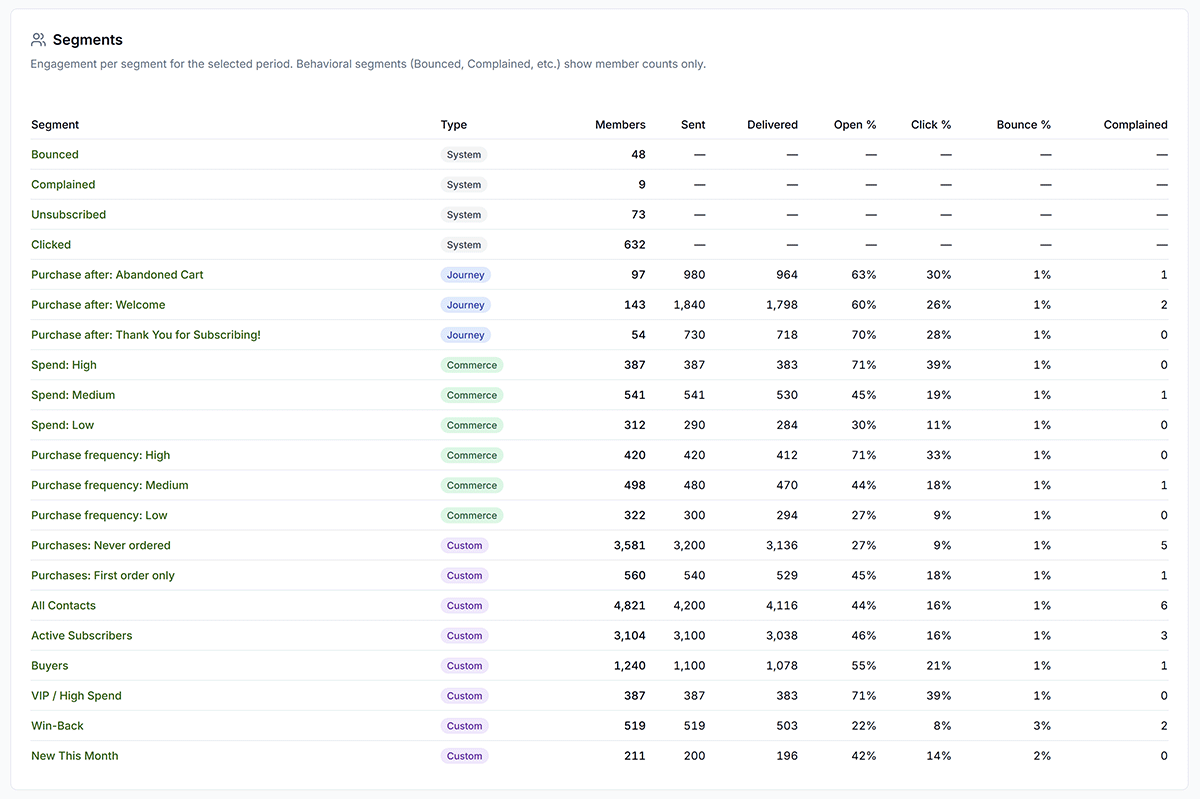
Commerce segments update dynamically from your store order data. If this section does not appear, verify that your store is connected.
Monitor the size and growth of key contact segments to gauge overall list health:
- If the Bounced segment exceeds 5% of your total contacts, stop sending to unverified addresses and clean your list.
- If the Complained segment is growing, reduce send frequency and review your list acquisition sources.
- The Clicked segment is your most engaged audience — use it as the target for your next campaign to maximize results.
See Segments for how to build and manage contact segments.
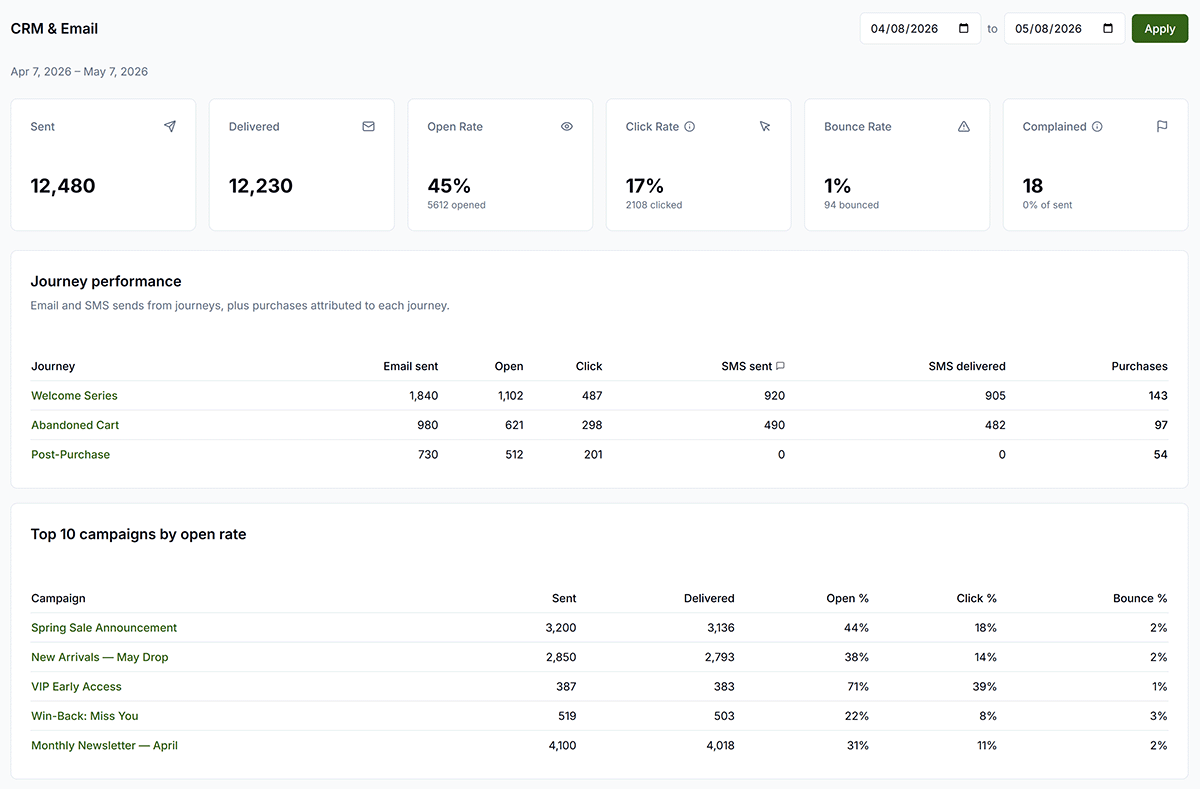
The CRM & Email tab on the Analyze page shows Brand-level performance across all campaigns and journeys for a selected date range, and individual campaign detail pages show metrics for a single send. Both views support date range filtering.
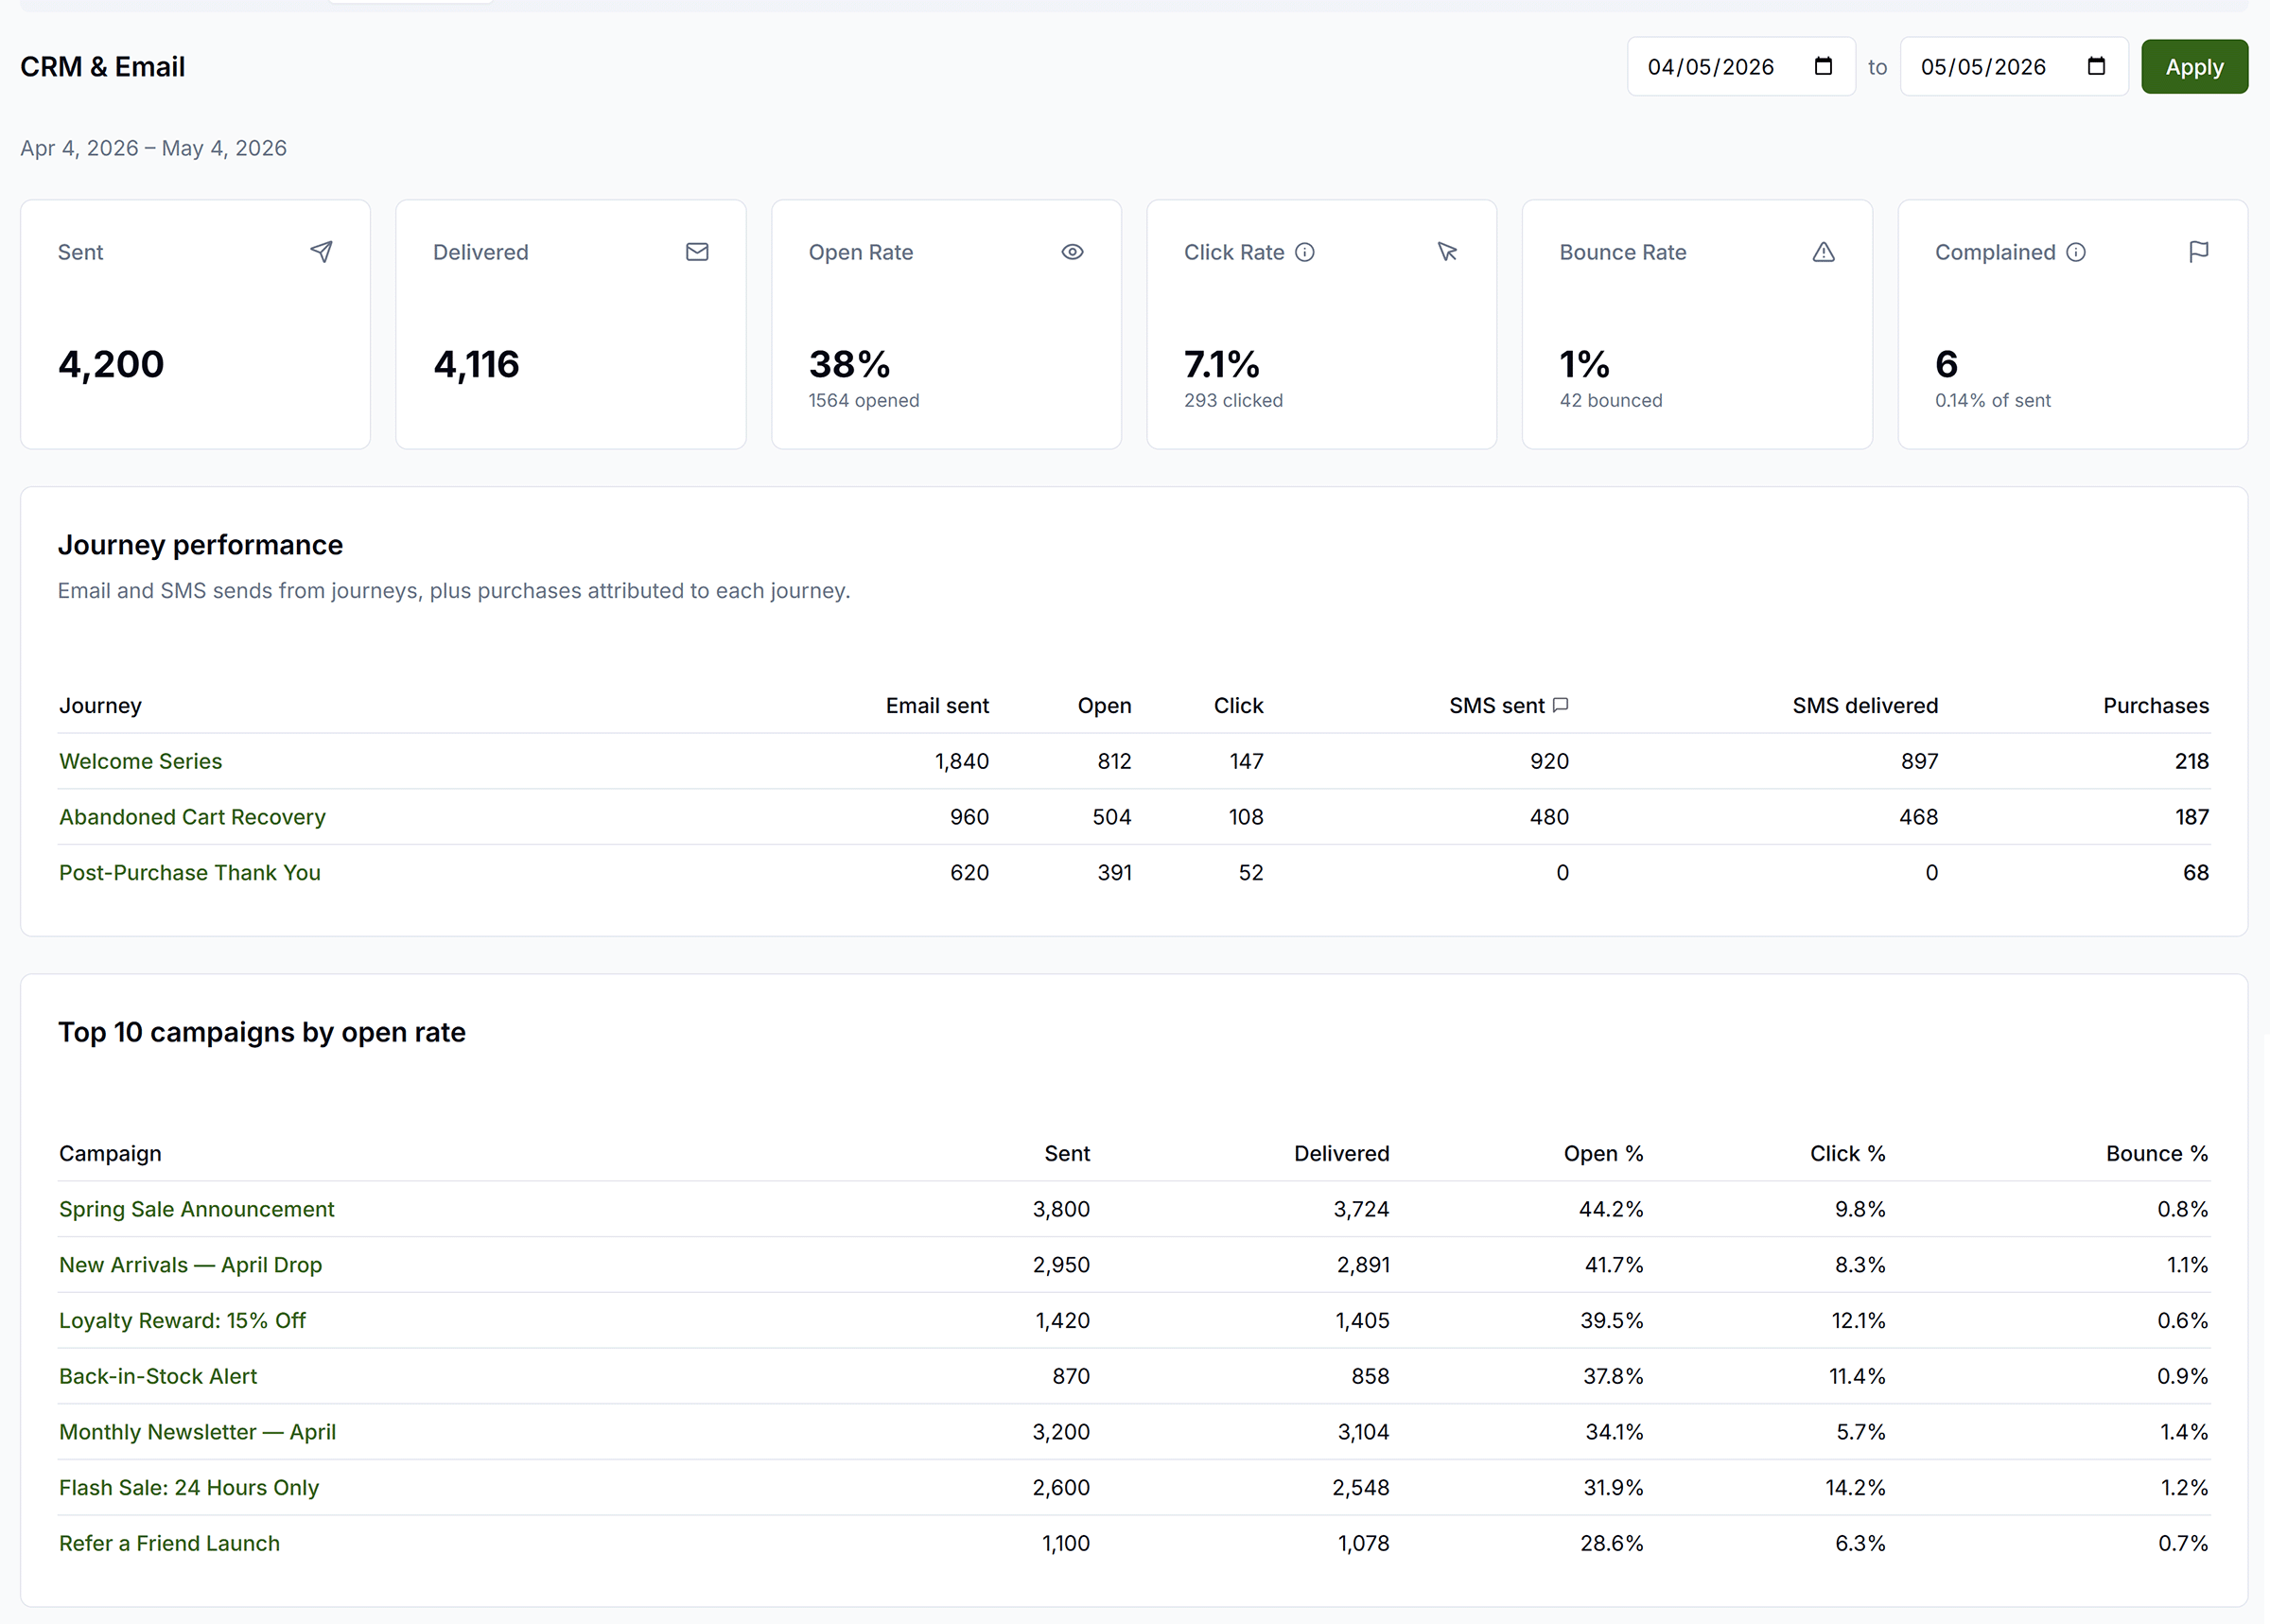
Using the Email Tab
- Set a From and To date at the top of the tab, then click Apply to load data. Default is the last 30 days. Changing dates alone does not refresh — you must click Apply.
- Six summary metric cards display aggregate performance for the period: Sent, Delivered, Open Rate, Click Rate, Bounce Rate, and Complained.
- The Journey performance table shows per-journey email and SMS stats (when journeys are active).
- The Top 10 campaigns by open rate table shows your best-performing campaigns for the period, with Sent, Delivered, Open %, Click %, and Bounce % columns.
Key Metrics
- Sent — total emails attempted (campaigns + journeys combined)
- Delivered — emails that reached the inbox (sent minus bounced)
- Opened — unique recipients who opened the email
- Clicked — unique recipients who clicked a link
- Bounced — emails that could not be delivered (hard and soft)
- Complained — recipients who marked the email as spam
- Unsubscribed — recipients who opted out
- Open Rate — opened ÷ delivered
- Click Rate — clicked ÷ delivered
- Click-to-Open Rate (CTOR) — clicked ÷ opened
- Bounce Rate — bounced ÷ sent
- Complaint Rate — complained ÷ sent
Benchmarks
Use these benchmarks to evaluate your performance:
| Metric | Healthy | Needs Attention |
|---|---|---|
| Open Rate | > 20% | < 15% |
| Click Rate | > 2% | < 1% |
| Click-to-Open Rate | > 15% | < 10% |
| Bounce Rate | < 2% | > 5% |
| Complaint Rate | < 0.1% | > 0.3% (risk of suspension) |
| Unsubscribe Rate | < 0.5% | > 1% |
Interpreting Your Results
- Low open rate (< 15%) — A/B test subject lines; check send time; verify your sender domain reputation is healthy
- High bounce rate (> 5%) — clean your contact list; exclude the Bounced segment from future campaigns
- High complaint rate (> 0.3%) — reduce send frequency; review list acquisition source; consider adding double opt-in
- Low click rate (< 1%) — improve CTA copy; test button placement; make sure the offer matches your audience segment
- Strong journey completion (> 70%) — consider extending the sequence with additional steps
Open and click data may lag 1–2 hours after sending as stats are collected from our email delivery provider. Bounces and complaints update in near real-time.
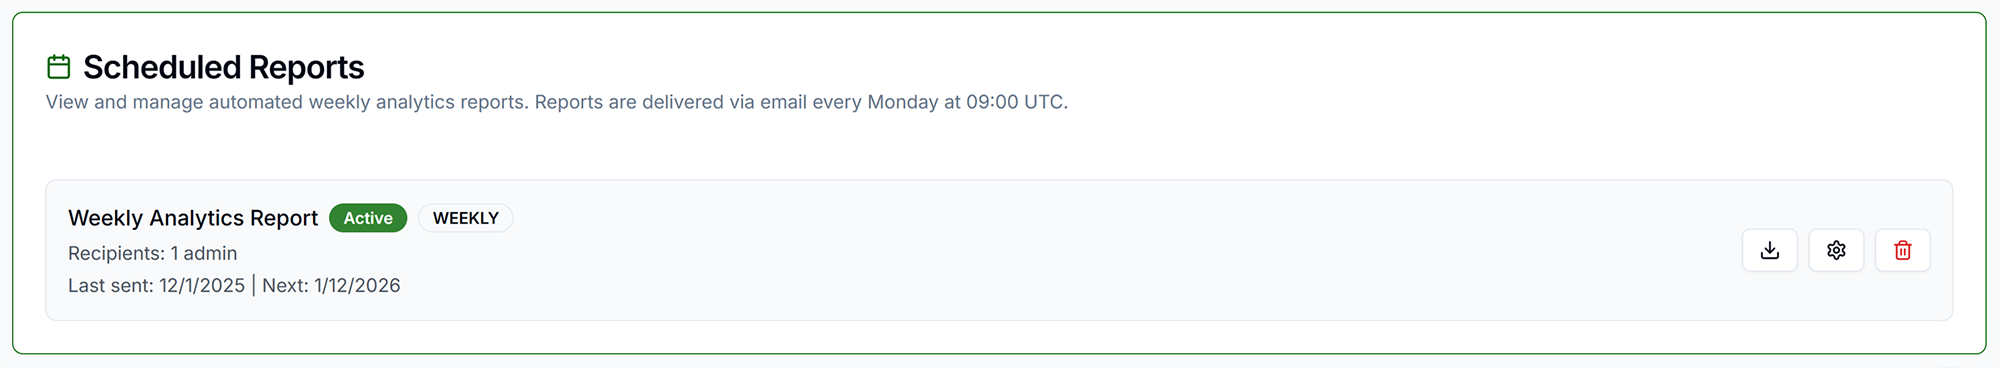
Scheduled Reports
The Scheduled Reports card appears on the Social Media, Email, and Analysis tabs. It requires Pro or Agency plan and an Admin or Super Admin role.
- Configure automated weekly PDF reports emailed to brand admins — sent every Monday at 09:00 UTC
- Set the report name, date range (last 7 / 30 / 90 / 365 days, or all time), recipients, and whether to include charts
- Use the Download button to generate a white-labeled PDF immediately for any configured report
- Edit, delete, or toggle reports active/inactive from the same card
Troubleshooting
"No analytics data" or empty Social tab
Causes: No social platforms connected; no Shouts published through Get Shouting.
Solution: Connect platforms in Account settings; publish Shouts from the Create page.
Analysis tab not visible
Causes: Plan is not Pro or Agency.
Solution: Upgrade to Pro or Agency plan in Billing.
Email tab not visible
Causes: Email is not enabled on your plan.
Solution: Confirm you have an Email CRM plan; check with your agency admin if applicable.
"Failed to fetch unified analytics"
Causes: Network or API error; social connection expired.
Solution: Check your connection and try again; reconnect platforms in Account settings; contact support if it persists.
"No historical data available"
Causes: No published Shouts in the selected date range; daily snapshots not yet populated.
Solution: Try a different date range (e.g., Last 90 days or All time); publish more content and check again later.
"Top Posts" shows empty
Causes: No shouts published through Get Shouting in the last 90 days; published Shouts have no analytics data yet.
Solution: Publish shouts from the Create page; wait up to 24 hours for platform APIs to return metrics.
"Scheduled Reports" not visible or restricted
Causes: Plan is below Pro; user is not Admin or Super Admin.
Solution: Upgrade to Pro or Agency plan; ensure your role has report management access.
Open/click rates not updating
Causes: Email open/click data relies on webhooks from our email delivery provider and may lag 1–2 hours.
Solution: Wait 1–2 hours and refresh; check that your sender DNS is properly configured.
Commerce data not showing
Causes: Store not connected, or Email or CRM not enabled on the integration.
Solution: Connect your store in Brand Settings and enable Email and CRM.
AI summary loading slowly
Solution: The AI summary is generated fresh and may take up to a minute on first load. Subsequent views use a cached result and will load quickly.
SMS columns show all zeros
Solution: Verify SMS is enabled on your account; check that your journey has active SMS steps with enrolled contacts.
Best Practices
- Connect all platforms — more platforms mean more complete social analytics
- Publish through Get Shouting — post-level metrics only apply to Shouts published via the app
- Check Historical Trends regularly — use date ranges to spot patterns and seasonality
- Review Top Posts — learn what content performs best and replicate it
- Use the Analysis tab (Pro) — let the AI surface wins and action items across all channels
- Watch your complaint rate — keep below 0.1%; above 0.3% risks email suspension
- Set up Scheduled Reports (Pro & Agency) — get weekly PDF summaries delivered automatically every Monday
- Expand platform cards — use category grouping to dig into Audience, Reach, Engagement, and Content metrics
Social Analytics
The Social Media tab is always visible and shows performance data for content published through Get Shouting across all connected platforms.
Prerequisites
Aggregate Metrics
Five aggregate cards at the top collect cumulative totals across all connected platforms:
Three charts are displayed alongside the cards: a Followers pie chart (distribution by platform), an Engagement stacked bar chart (likes, comments, and shares by platform), and a Views pie chart.
Historical Trends
Line charts for engagement and views over time, each with a trend percentage badge. Select a date range preset — Last 7 days, Last 30 days (default), Last 90 days, Last year, or All time — to reload the data.
Top Posts by Engagement
Your 3 top-performing posts from the last 90 days (this window is fixed and not adjustable). Engagement score is calculated from likes, comments, shares, and views. Click a post to view it on the source platform.
Platform Analytics Cards
One card per connected platform (Instagram, Facebook, TikTok, etc.) shows platform-specific metrics. If you have questions about a metric, hover or click the ? icon for an explanation.
Platform Delay Warnings
Some platforms show a delay info icon with tooltip: